Session 1.1
Causal questions and counterfactuals in pregnancy research Intro to R
Hello!
Workshop goals
- Understand how theory gets implemented in code
- I’ve tried to integrate them
- Take away code snippets, but with ability to understand how to modify
- Know where to look in the literature
- Open time to practice/ask questions
Everyone is coming with a different background, so some things will likely be a review. Hopefully even if you’ve seen these topics before you will be thinking about them in a new or deeper way!
Daily schedule
| Time | Activity |
|---|---|
| 09:30–10:30 | Session Block 1 |
| 10:30–11:00 | Tea/Coffee break |
| 11:00–12:00 | Session Block 2 |
| 12:00–13:00 | Lunch |
| 13:00–14:00 | Session Block 3 |
| 14:00–14:30 | Tea/Coffee break |
| 14:30–15:30 | Q&A/Office Hours |
Resources (R)
R can be overwhelming if you’re not used to it
I teach a couple of short courses on R (for you to peruse later)
- intro course: https://id543.louisahsmith.com/
- intermediate course: https://epi590r.louisahsmith.com/
These also link to more resources that may be helpful
Why this topic?
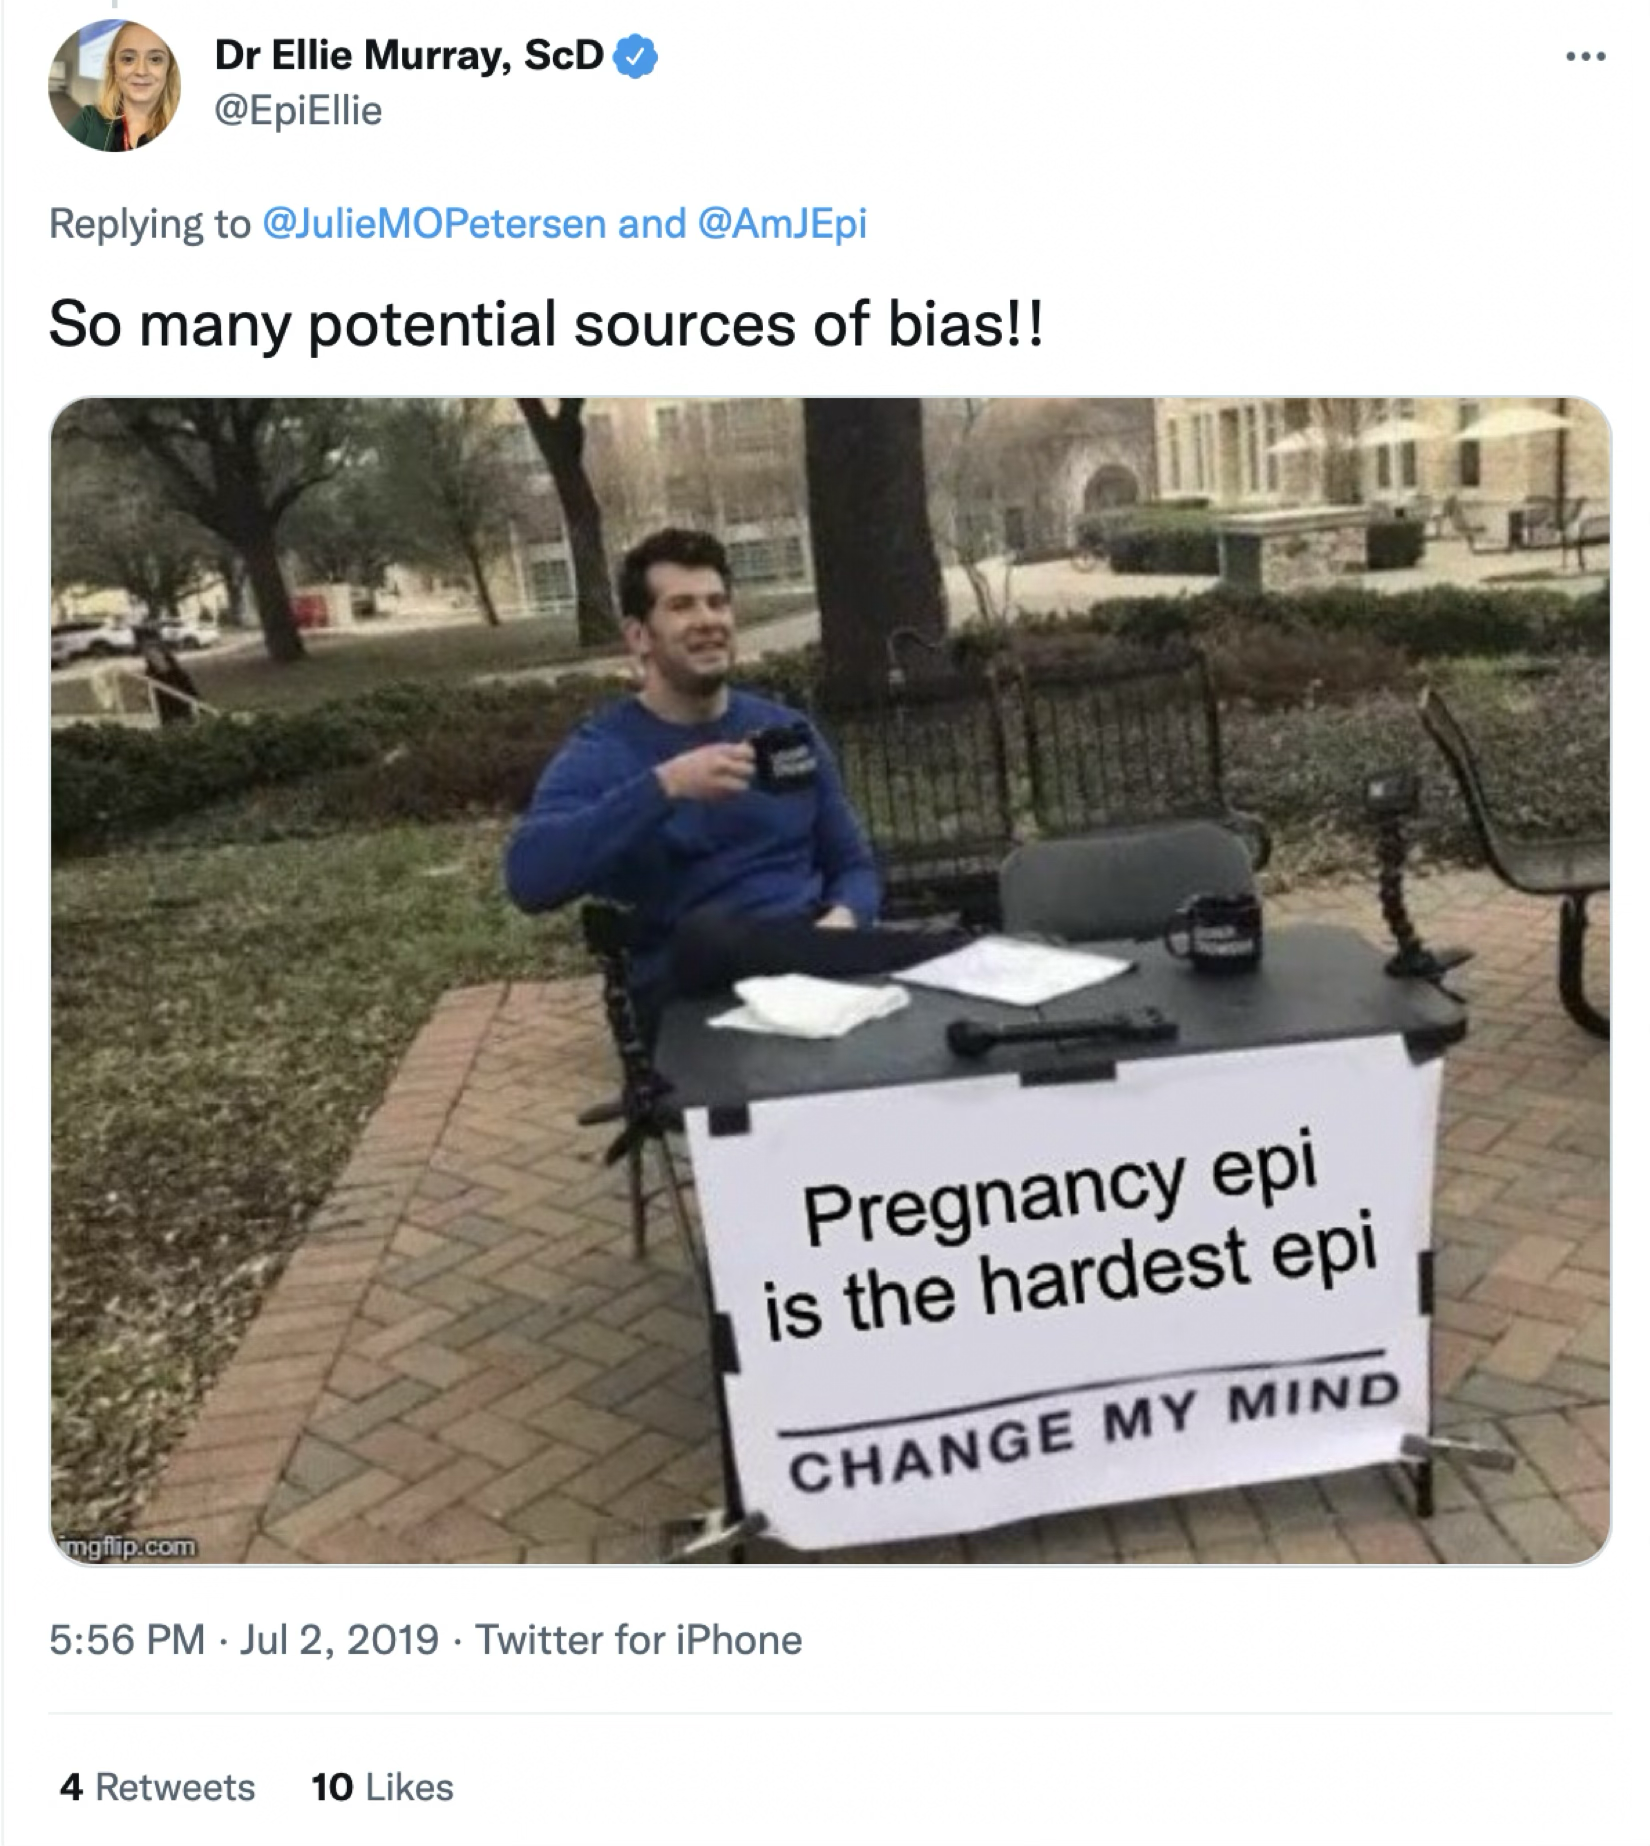
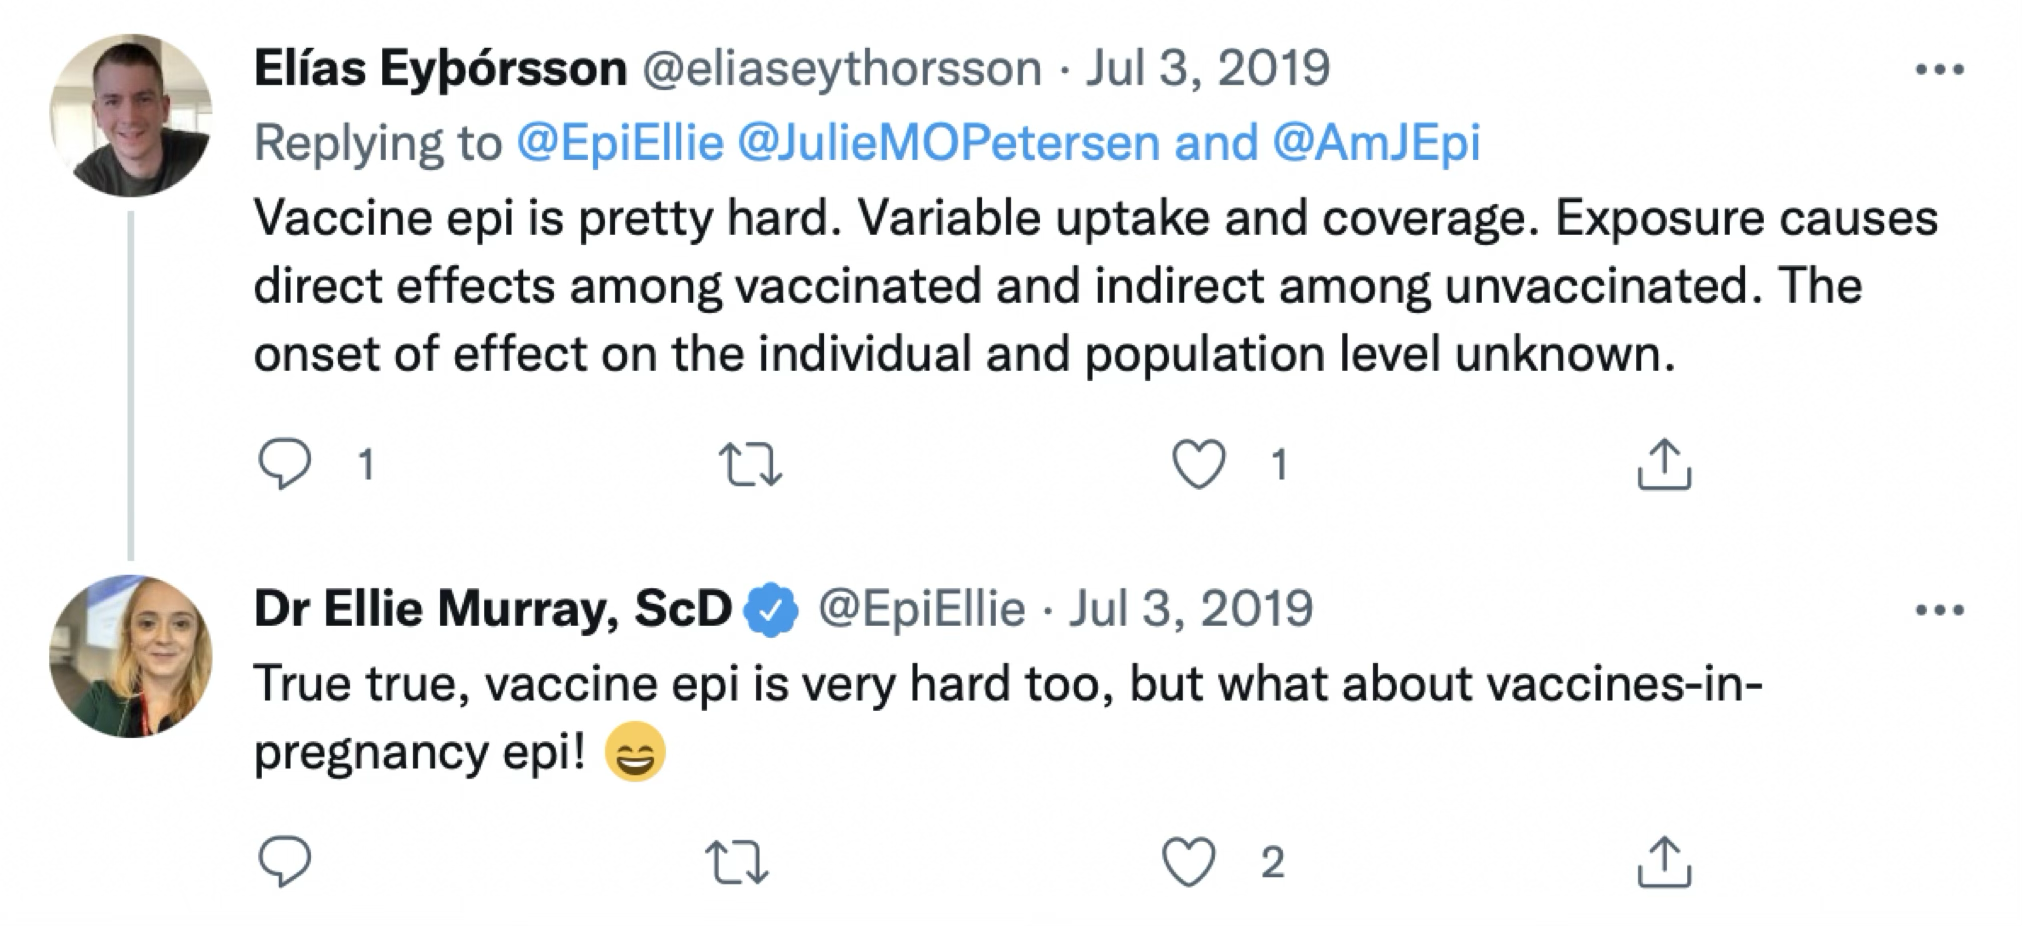
What makes pregnancy research challenging? (an incomplete list!)
- Time-varying exposures during gestational development with varying relationships to outcomes
- Competing events (e.g., conception, pregnancy loss)
- Outcomes that often depend on duration of pregnancy or exposure during pregnancy
- Exposure timing during pregnancy can create immortal time bias
- Multiple individuals (pregnancy, fetus, child)
Some (but maybe not all) of these problems can be addressed with…
- Careful specification of a causal question
- Analysis that matches the question
Miguel Hernán’s two-step algorithm for causal inference: Ask a causal question. Answer the causal question.
What are causal questions?
A second chance to get causal inference right: a classification of data science tasks Hernán, Hsu, and Healy (2019)
What proportion of pregnant people received COVID-19 vaccination during pregnancy in 2023?
How many preterm births occurred among women with gestational diabetes in our hospital last year?
What is the probability of preterm birth for a 35-year-old nulliparous woman with gestational diabetes?
How can we best guess which pregnancies will result in low birth weight based on first trimester characteristics?
Does COVID-19 vaccination during pregnancy reduce the risk of severe maternal illness compared to no vaccination?
Would discontinuing antidepressants during pregnancy reduce birth defect risk compared to continuing them?
description
What proportion of pregnant people received COVID-19 vaccination during pregnancy in 2023?
How many preterm births occurred among women with gestational diabetes in our hospital last year?
prediction
What is the probability of preterm birth for a 35-year-old nulliparous woman with gestational diabetes?
How can we best guess which pregnancies will result in low birth weight based on first trimester characteristics?
causation
Does COVID-19 vaccination during pregnancy reduce the risk of severe maternal illness compared to no vaccination?
Would discontinuing antidepressants during pregnancy reduce birth defect risk compared to continuing them?
Questions of causation generally involve changing something
- Does COVID-19 vaccination during pregnancy reduce the risk of severe maternal illness vs. no vaccination during pregnancy?
- Would discontinuing antidepressants during pregnancy reduce birth defect risk vs. continuing them?
- These questions involve comparing different interventions
- Note: I will refer to what is changed as “intervention” or “exposure” or “treatment” or “treatment strategy” basically interchangeably
- Contrast with: “What is the association between maternal age and preterm birth?”
- We’re not asking what would happen if we could change maternal age, but describing what the world actually looks like
- (We could ask a causal question about age, for example if we asked people to delay pregnancy until a different age…)
Counterfactual notation makes this clear
What would have happened under different treatment scenarios?
If \(Y\) is our factual (observed) outcome of interest:
- \(Y^1\): Outcome if someone receives treatment
- \(Y^0\): Outcome if someone does not receive treatment
More generally: \(Y^a\) = outcome under treatment scenario \(A = a\)
Pregnancy examples of counterfactuals
- \(Y^{\text{vaccinated}}\): Preterm birth if vaccinated during pregnancy
- \(Y^{\text{unvaccinated}}\): Preterm birth if not vaccinated during pregnancy
The fundamental problem of causal inference
We can only observe one potential outcome per person:
| ID | Vaccinated | Y | \(Y^{\text{vacc}}\) | \(Y^{\text{unvacc}}\) |
|---|---|---|---|---|
| 1 | 0 | Preterm | ??? | Preterm |
| 2 | 1 | Preterm | Preterm | ??? |
| 3 | 1 | Term | Term | ??? |
| 4 | 0 | Term | ??? | Term |
Missing data problem: Causal inference is about estimating the missing potential outcomes using data from people with observed outcomes
The fundamental problem of causal inference
We can only observe one potential outcome per person:
| ID | Vaccinated | Observed | \(Y^{\text{vacc}}\) | \(Y^{\text{unvacc}}\) |
|---|---|---|---|---|
| 1 | 0 | Preterm | ??? | Preterm |
| 2 | 1 | Preterm | Preterm | ??? |
| 3 | 1 | Term | Term | ??? |
| 4 | 0 | Term | ??? | Term |
- Consider something like matching, where we would match a vaccinated with an unvaccinated person with similar characteristics (confounders) to estimate the missing potential outcomes for each
But what does the variable “Vaccinated” mean? How can we be sure that we make a fair comparison?
A common pregnancy question
“If I use this treatment during pregnancy, do I have an increased risk of some outcome?”
Problems with this question:
- Implied comparison is with “expected risk in population”
- Doesn’t specify when treatment is used
- Doesn’t define the alternative strategy
- Could be descriptive rather than causal
A better pregnancy causal question
“If I use this treatment during pregnancy, do I have an increased risk relative to if I had not used it?”
This translates to: “What is the average risk in people like me who use the medication relative to the risk in an identical group who do not?”
But we need to be even more specific
Among users:
- What is the risk for discontinuation of the drug vs. continuation?
- What is the risk for switching to a different drug vs. continuation?
Among non-users (or former users):
- What is the risk for initiation of the drug vs. no treatment?
All compared to an identical population who does something different.
And we need to be specific about timing
- When trying to become pregnant?
- At a specific gestational age?
- When certain clinical characteristics are met?
The comparison population might do the same thing but at a different time (e.g., effect of earlier vs. later treatment), might do a different thing (e.g., treatment with a different drug), might do the same thing but more/less (different dose or duration), or might not do anything at all (but could have!)
More precise counterfactuals
We can be more specific:
- \(T^{x=12}\): Gestational age at delivery if vaccinated at 12 weeks
- \(T^{x=22}\): Gestational age at delivery if vaccinated at 22 weeks
- \(T^{x\neq12}\): Gestational age at delivery if not vaccinated at 12 weeks (do anything you want, as long as not that?!)
Notice that we’re being more specific with the outcome as well, to allow us to study effects across gestational duration
This makes what we know and don’t know a little more complicated
| ID | Vaccination week | T | \(T^{x=12}\) | \(T^{x=22}\) | \(T^{x\neq12}\) |
|---|---|---|---|---|---|
| 5 | Never | 11 | 11 | 11 | 11 |
| 6 | Never | 14 | ??? | 14 | 14 |
| 7 | 12 | 18 | 18 | ??? | ??? |
| 8 | 34 | 40 | ??? | ??? | ??? |
We will see how to figure out what counterfactuals we can estimate
- Target trial emulation helps us specify exactly which counterfactuals we want to estimate
- Different research questions require different counterfactuals
- Not all counterfactuals are identifiable from observational data
- The choice affects both study design and analysis approach
Exercises are in Quarto documents
- Quarto is a publishing system that combines text, code, and output
- Built into RStudio (new-ish versions)
- Similar to R Markdown but with enhanced features
- Files end in
.qmd
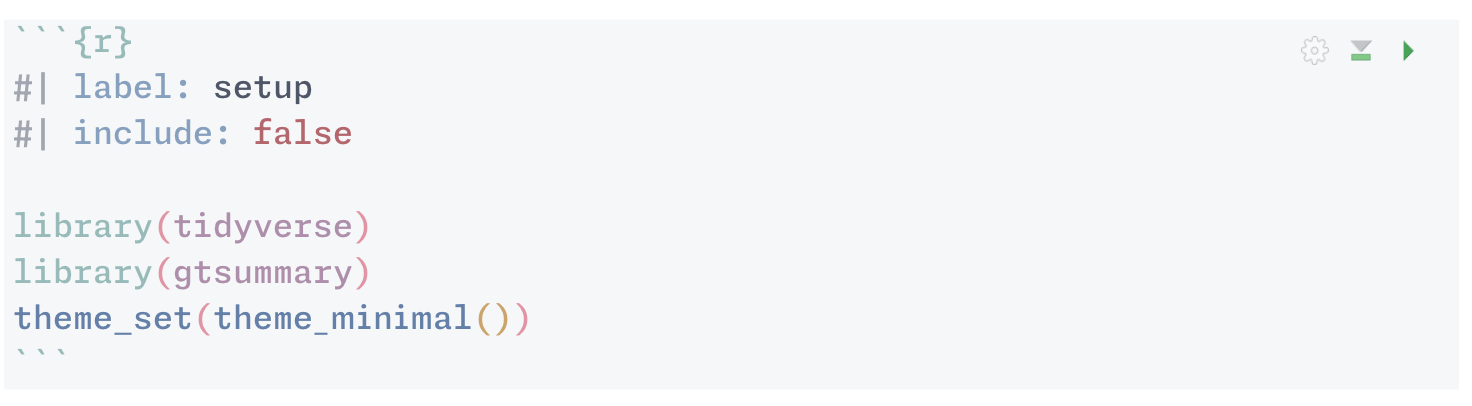
- Code goes in “chunks” surrounded by three backticks (chunks will be a slightly different color in RStudio)
- Text is written in Markdown in between chunks
- You can run individual chunks or render the whole document
- Output appears below each chunk when you render it
These slides are made in quarto too, so I can generate output using R code!
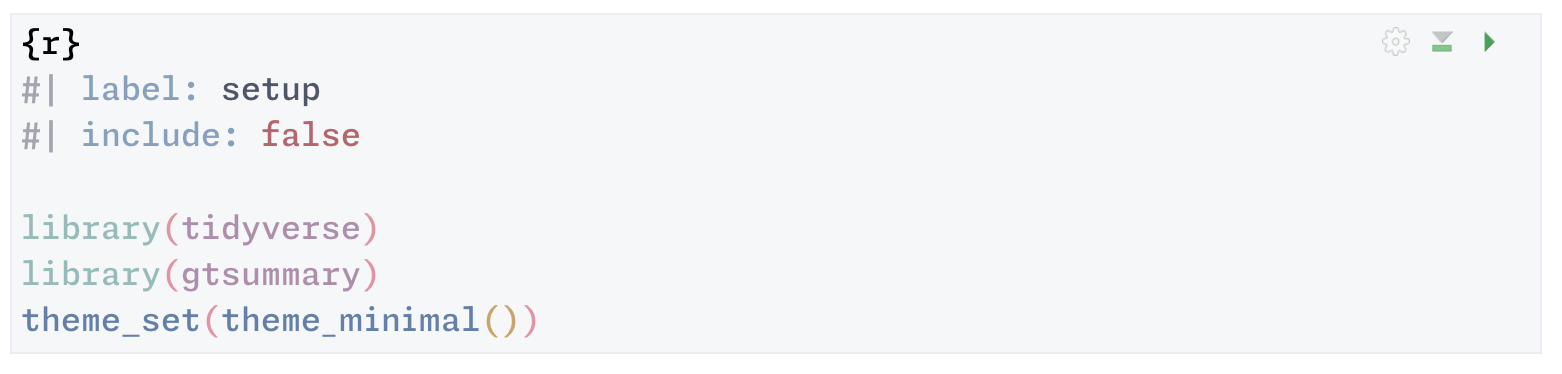
First code chunk: set-up
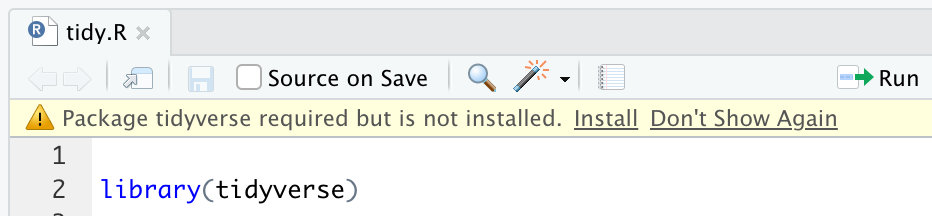
I asked you to install some packages with install.packages()
- It’s not a problem if you didn’t, but you will have to install them before running the code
- Running
install.packages("packagename")will install the most recent version of the package to ensure you get the same results as me
If you don’t have a package installed, you may see this (you can click Install!)
First code chunk: set-up
Every time you start a new R session (which I suggest you do often, including with every new set of exercises), you need to load the packages with library(packagename)
I also set a ggplot theme at the top, so it applies to all figures
What you’ll actually see
You can run the whole chunk at once with the green “play” button, or run line-by-line with Cmd+Enter (Mac) or Ctrl+Enter (Windows)
We are going to read in some simulated data
I made more than we need, so we are just going to sample n = 10,000 pregnancies, but we may change that as we go
Setting the seed ensures that we get the same random sample each time we run this code
Where did the data come from?
- Baseline covariates were generated to reflect real-world Norwegian registry data
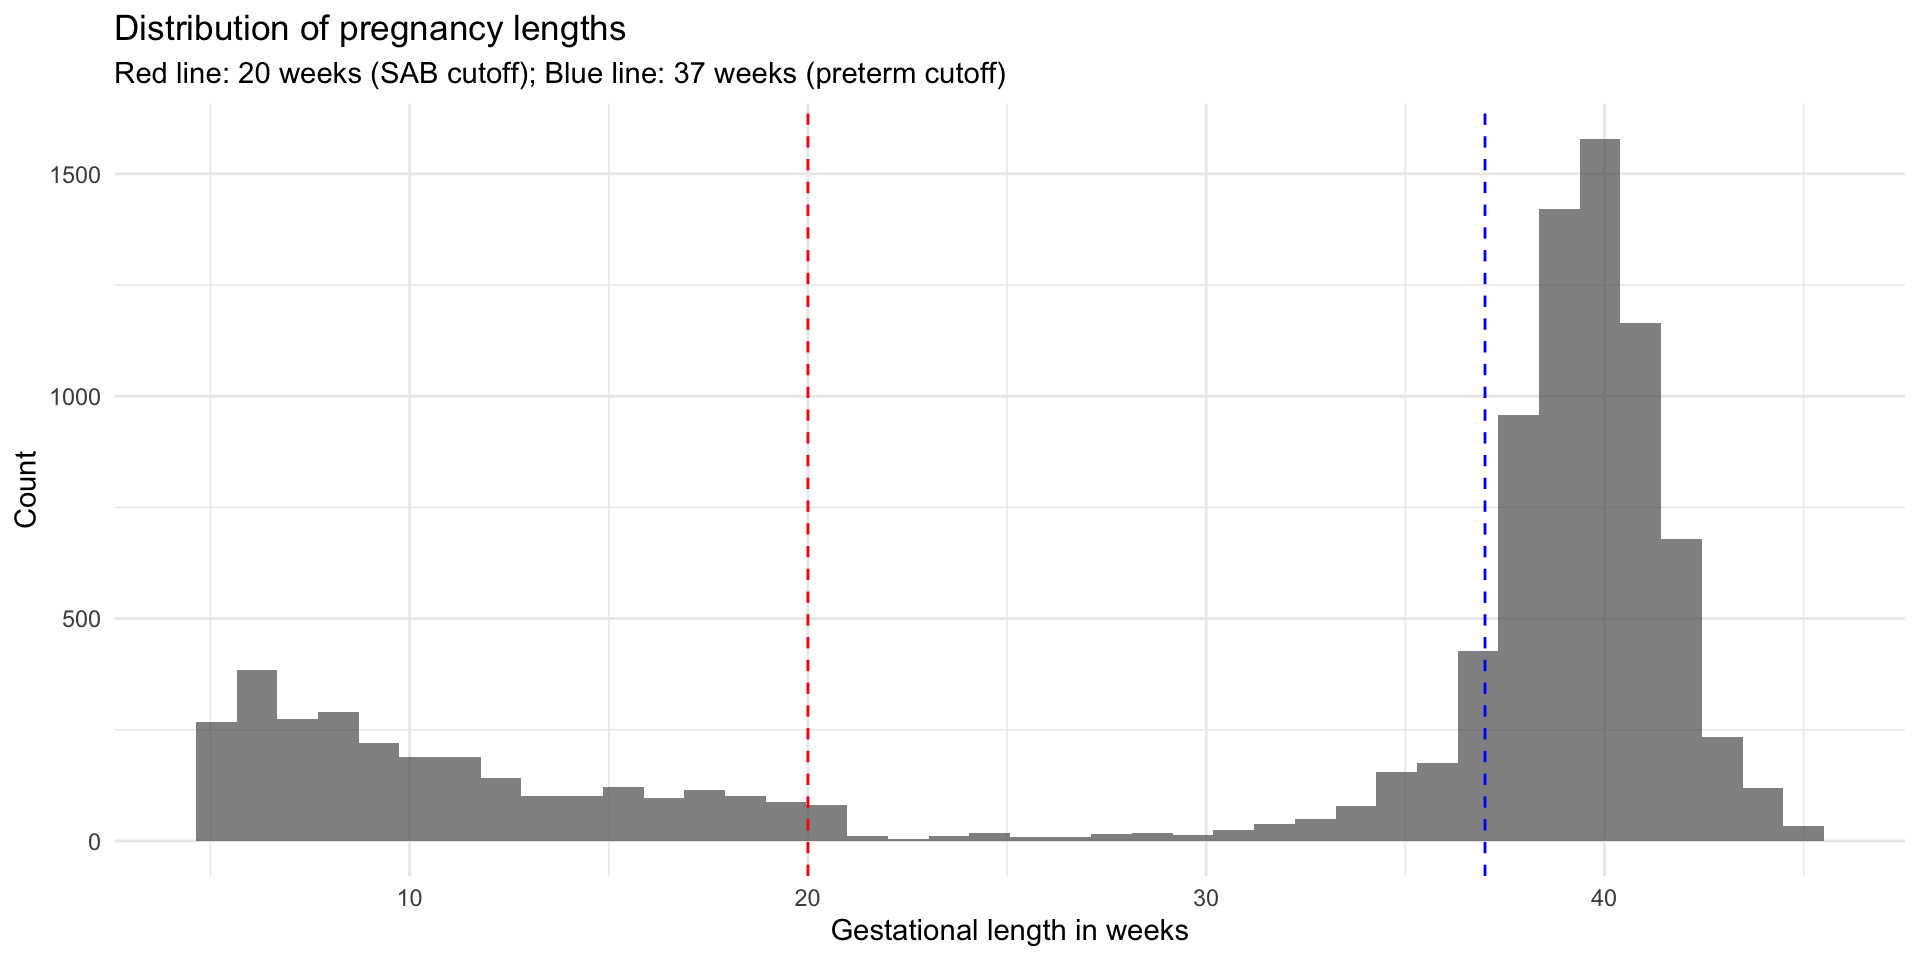
- I used the literature to inform the distribution of pregnancy duration starting at 6 weeks’ gestation and randomly assigned a length to each pregnancy
- Some time-varying covariates and birthweight were generated based on a model using the baseline covariates and gestational duration
- Spontaneous abortions and preterm births were defined based on gestational duration
- Stillbirth was assigned randomly among pregnancies that reached 20 weeks’ gestation
The data is somewhat but not totally realistic
Data dictionary (baseline)
| Variable Name | Description |
|---|---|
| ID | Unique pregnancy identifier |
| maternal_age | Maternal age at conception (years) |
| BMI_b4preg | Pre-pregnancy body mass index (kg/m²) |
| Riskfactors | Pre-existing risk factors (low vs. moderate or high) |
| educ | Educational level (low vs. high) |
| nullparity | Nulliparity (1 if first pregnancy, 0 if multiparous) |
| country_birth | Country of birth (Scandinavia vs. Outside Scandinavia) |
Data dictionary (pregnancy)
| Variable Name | Description |
|---|---|
| bleeding_beforeWk13 | Bleeding before week 13 (0/1) |
| bleeding_week13_28 | Bleeding between weeks 13 and 28 (0/1) |
| bleeding_afterWk28 | Bleeding after week 28 (0/1) |
| gest_week | Gestational age at delivery/pregnancy end (weeks) |
| gest_days | Gestational age at delivery/pregnancy end (days) |
| sab | Spontaneous abortion (1 if pregnancy ended <20 weeks, 0 otherwise) |
| stillbirth | Stillbirth (1 if fetal death ≥20 weeks, 0 if live birth, NA if SAB) |
| preterm | Preterm birth (1 if <37 weeks, 0 if ≥37 weeks, NA if SAB) |
| birthweight | Birth weight in grams (NA if SAB) |
| end_preg_event | Did we observe the pregnancy ending? (1 if yes, 0 if censored) |
Let’s look at the data
Let’s look at the data
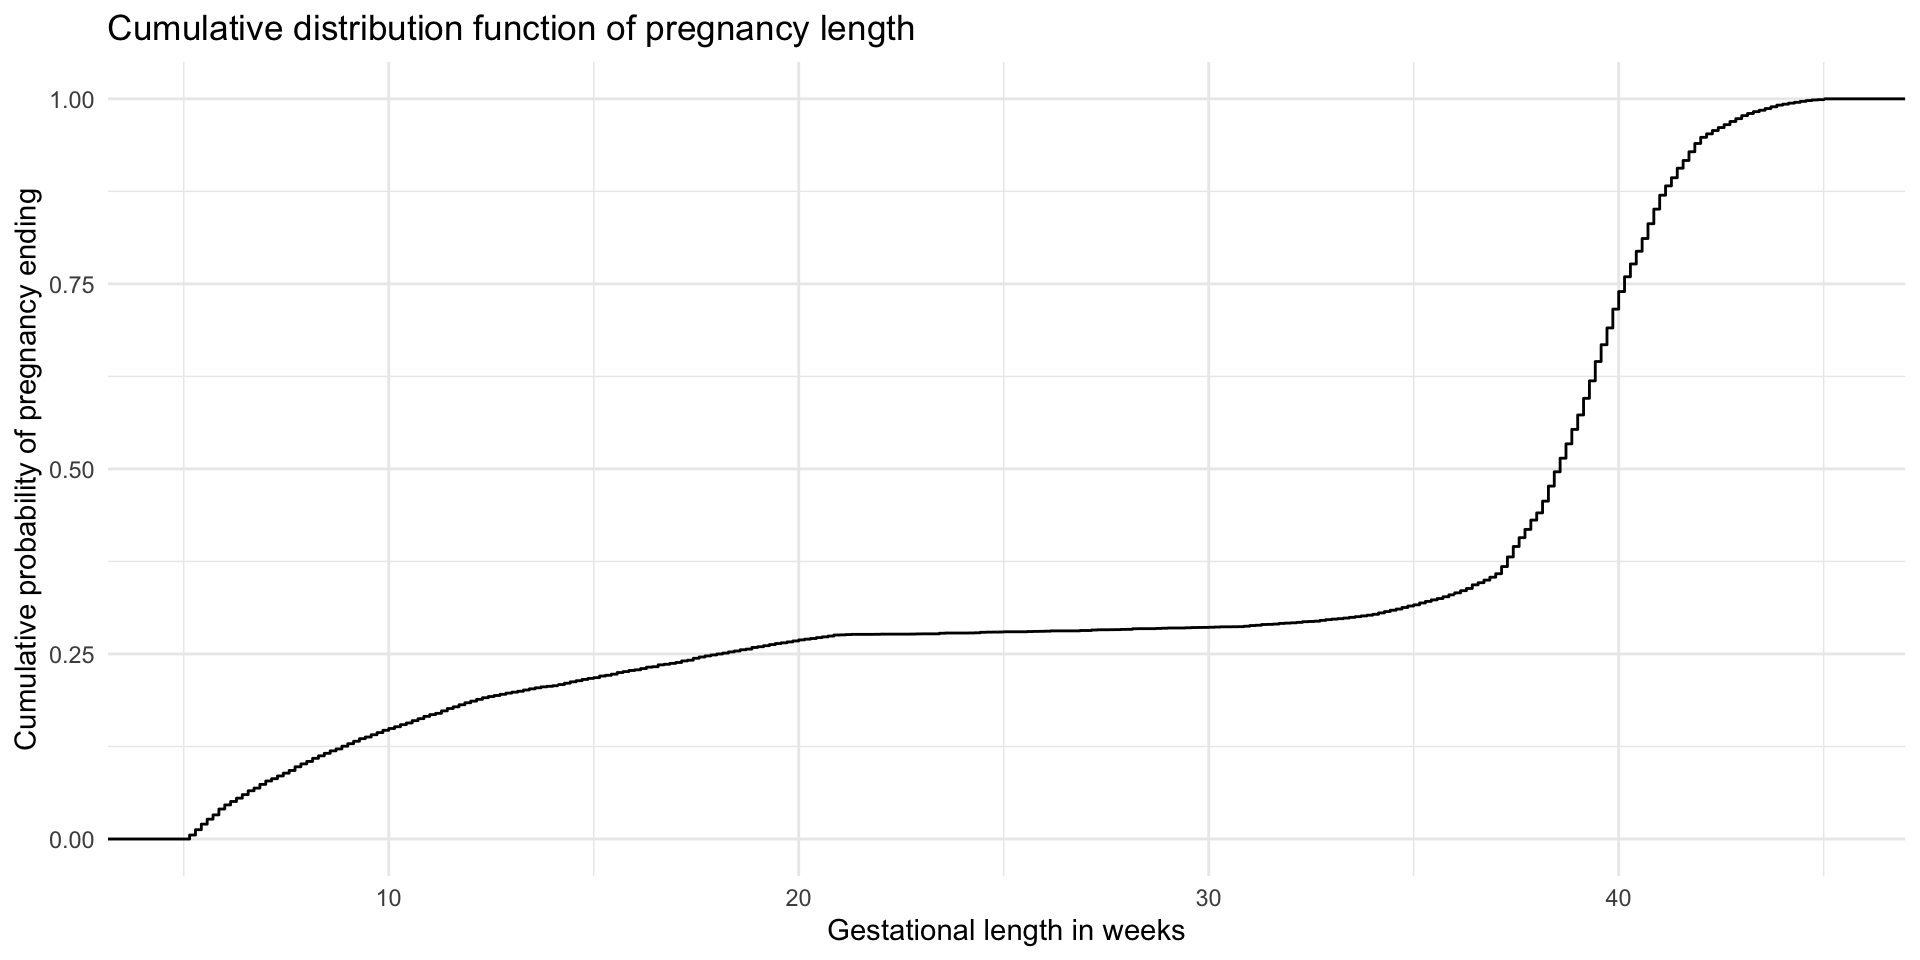
Let’s look at the data
Let’s look at the data
# Look at pregnancy outcomes
ggplot(dat, aes(gest_week)) +
  geom_histogram(bins = 40, alpha = 0.7) +
  geom_vline(xintercept = 20, linetype = "dashed", color = "red") +
  geom_vline(xintercept = 37, linetype = "dashed", color = "blue") +
  labs(
    y = "Count",
    title = "Distribution of pregnancy lengths",
    subtitle = "Red line: 20 weeks (SAB cutoff); Blue line: 37 weeks (preterm cutoff)"
  )
Let’s look at the data